Korona Gór Polski
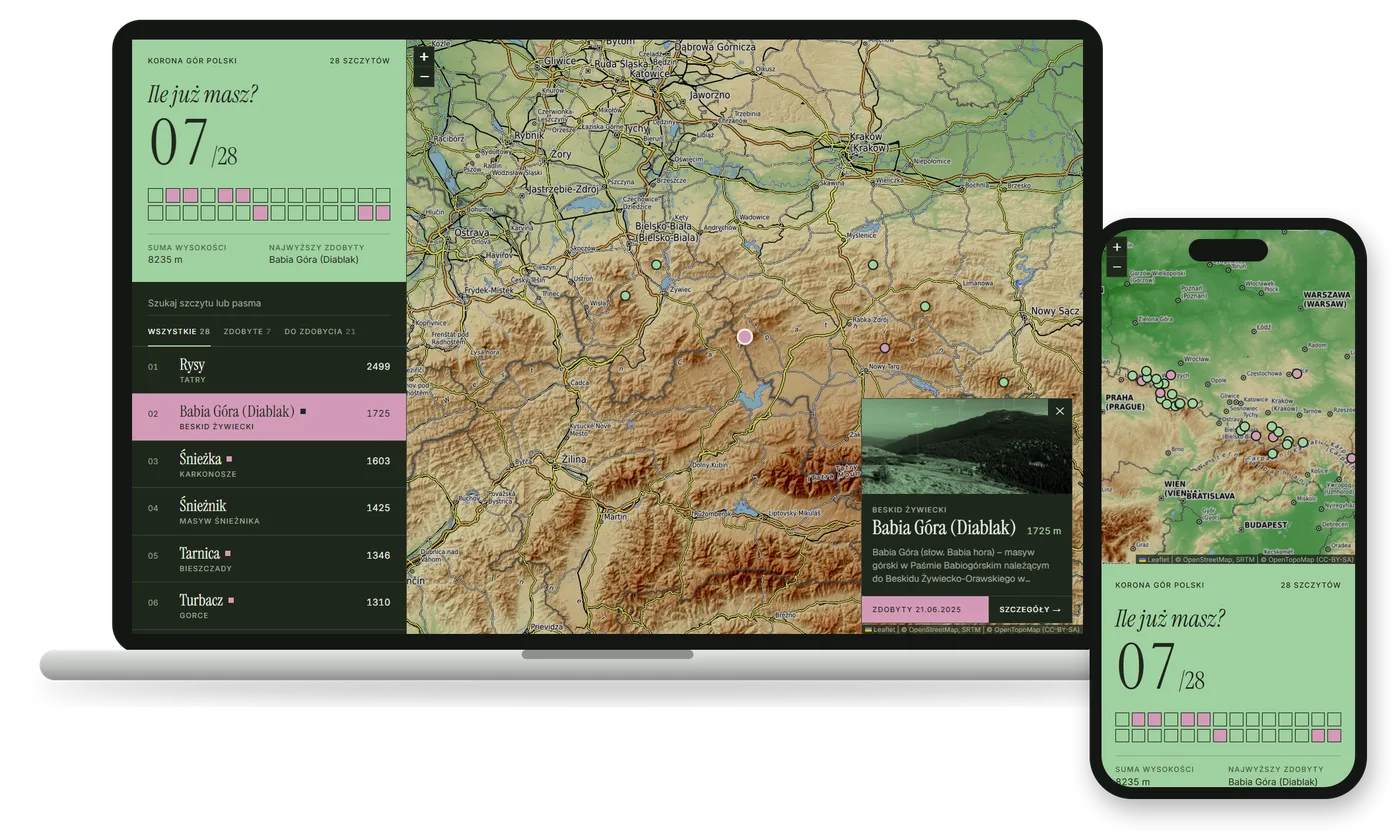
Korona Gór Polski (the Crown of Polish Mountains) is a list of the highest peaks of 28 Polish mountain ranges. I built a web app where hikers can see every peak on a map, mark the ones they have climbed and check the summit weather, using data from public APIs.
- Role
- Frontend Developer
- Tools and technologies
- Next.js
- React
- TypeScript
- Tailwind CSS
- Leaflet
- REST APIs
Concept
Map and peak list
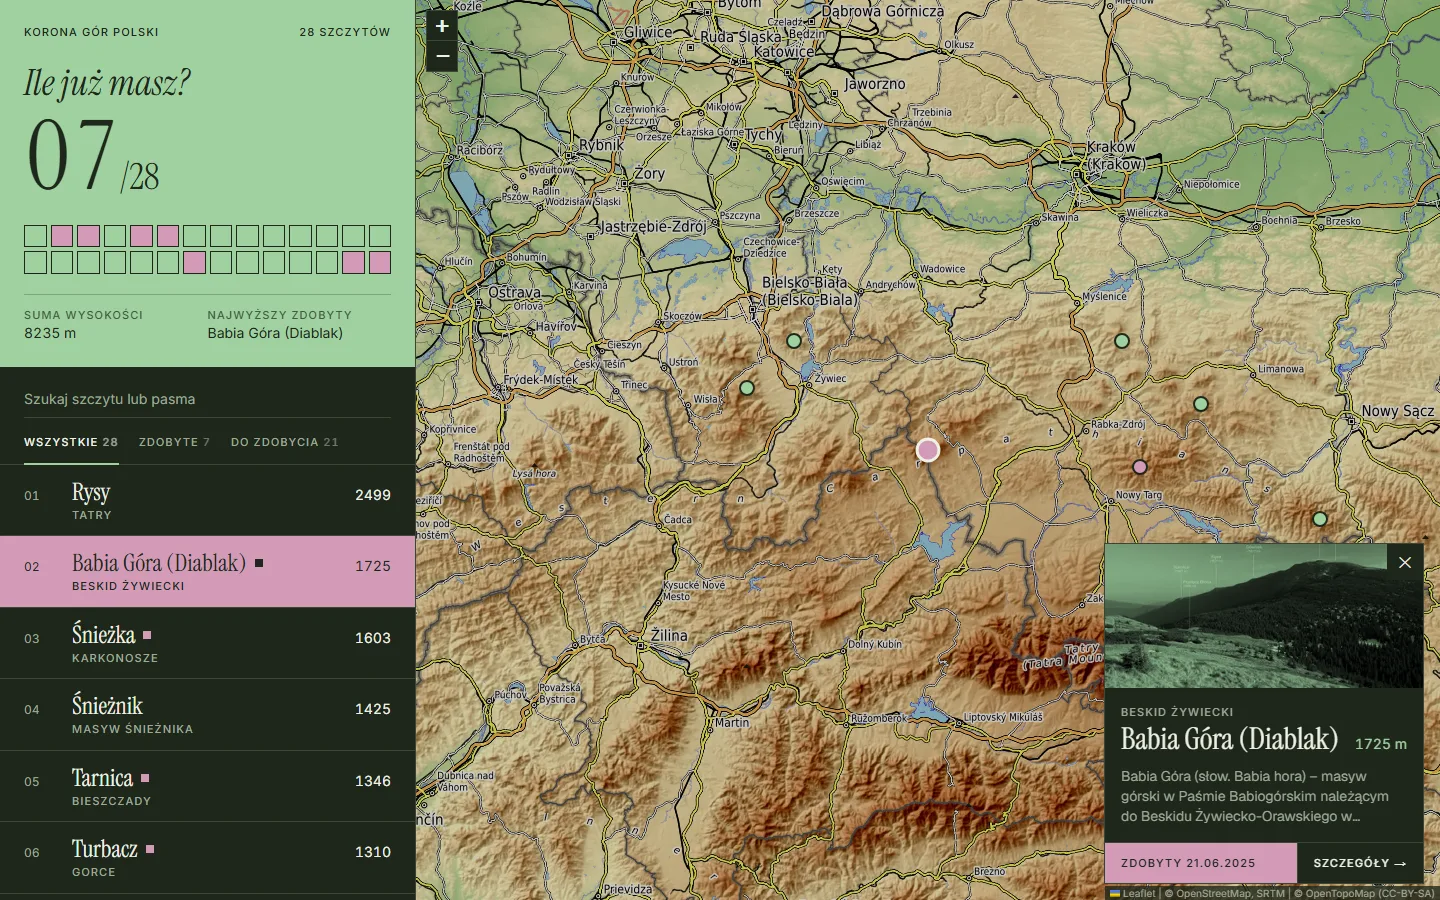
The home page combines a list of all 28 peaks with a topographic map. Users can search by peak or mountain range, filter the list by peaks they have or have not climbed, and select a peak on the list or the map. The map then flies to the peak and opens a card with a photo, a short description and a link to the peak page.
 (open full size in a new tab)
Data from APIs
Wikipedia
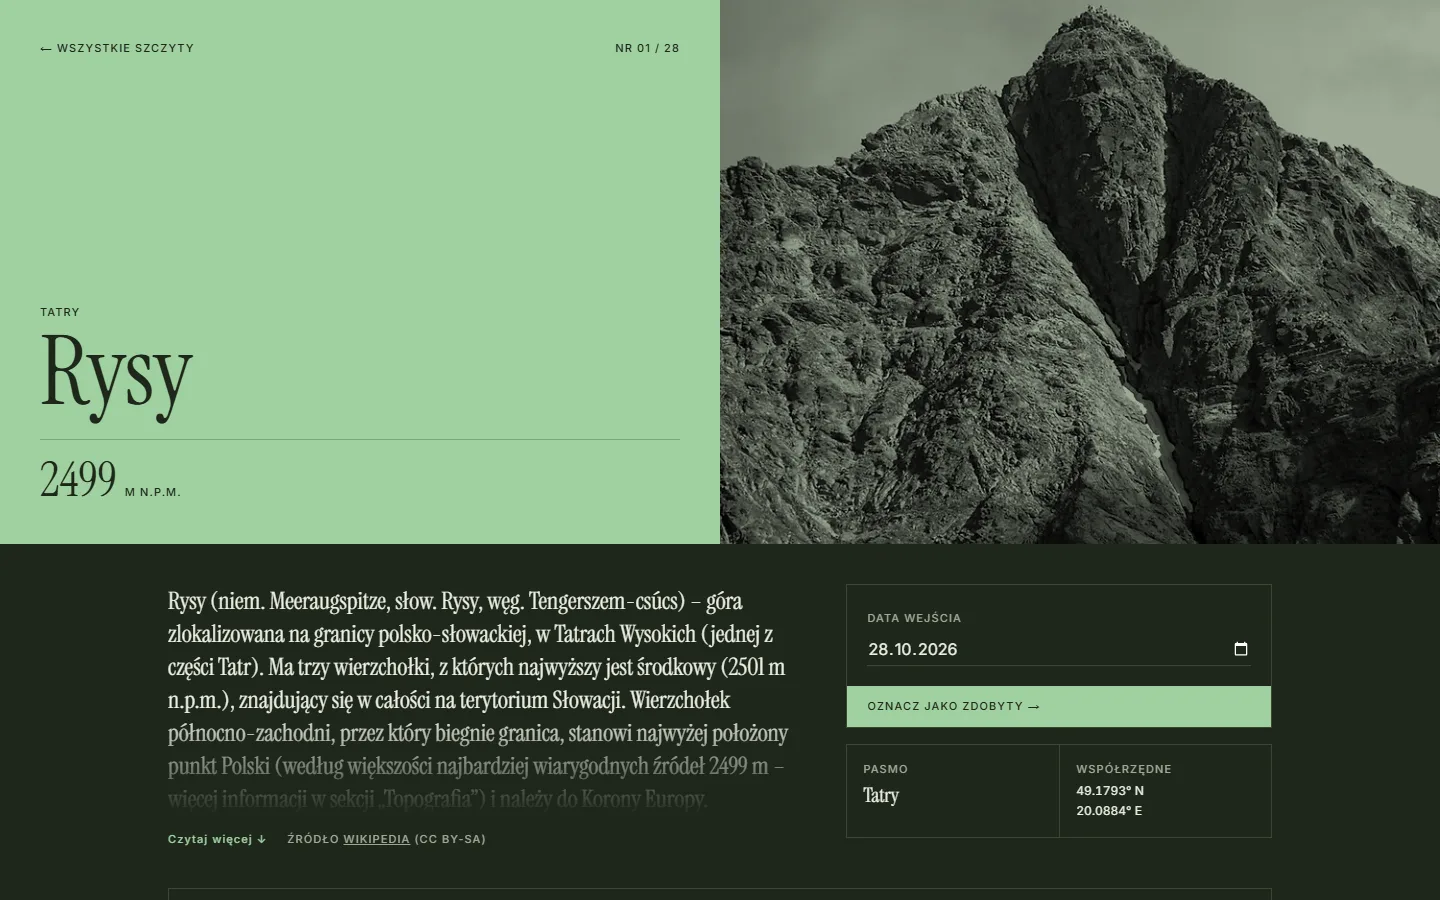
There is no API for the Crown itself, so the only data kept in the repository is the list of peaks: name, official height, range and the title of the Wikipedia article. Everything else, such as descriptions, photos and summit coordinates, comes from the Wikipedia API.
The data is fetched with the MediaWiki query API, which accepts many article titles in a single request, so all 28 peaks load in just two requests. The requests run in a React Server Component and the response is cached for 24 hours, so visitors never wait for Wikipedia.
 (open full size in a new tab)
Summit weather
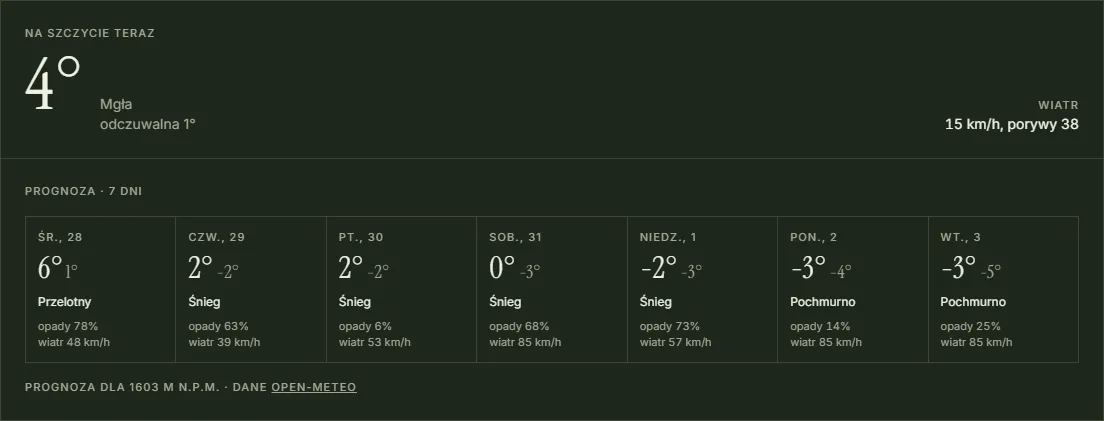
The weather comes from Open-Meteo. A forecast for a mountain is only useful when it describes the summit, not the valley, so I pass the height of the peak to the API, which then corrects the temperature for altitude. The forecast is cached for an hour and streamed in with Suspense, so the rest of the page does not wait for it.
 (open full size in a new tab)
Tracking progress
Saving climbed peaks
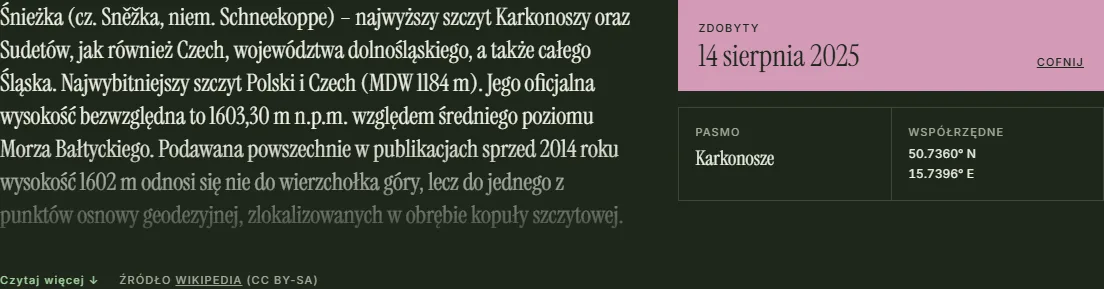
Climbed peaks and their dates are saved in localStorage, so the app works without an account. A small store built on React’s useSyncExternalStore keeps every component in sync, including other open tabs.
 (open full size in a new tab)
Celebrating a summit
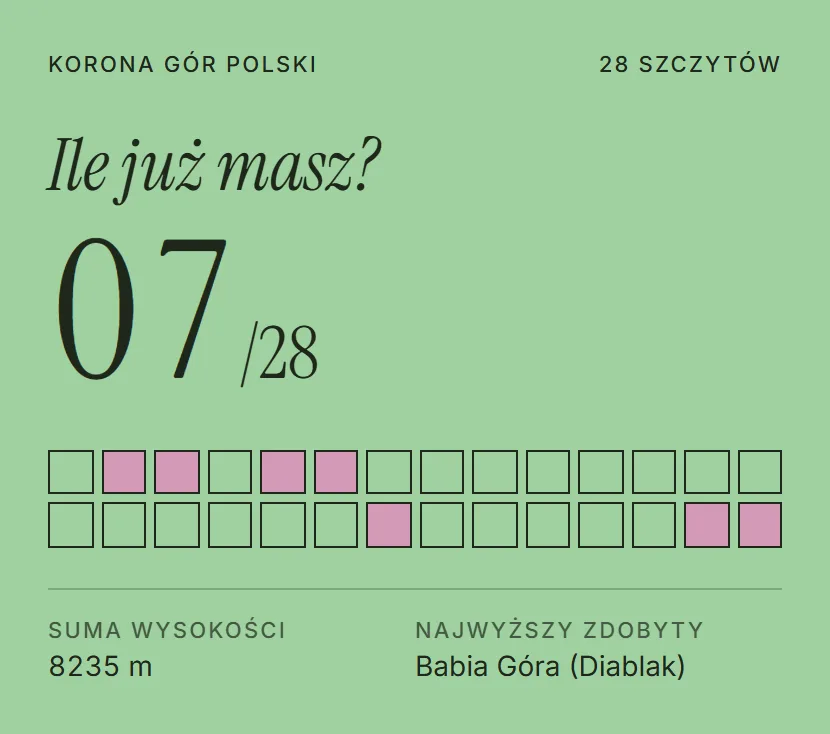
Progress is shown as 28 squares, one for each peak, and a large counter. Marking a peak as climbed is the most important action in the app, so it gets a small celebration: the counter rolls to the next number like a mechanical odometer, the square pops in pink, and pink rings spread from the peak on the map. The animations are plain CSS and switch off for users who prefer reduced motion.
 (open full size in a new tab)